Interoperability's tiny slice of the debt pie

The political class loves a good crisis. I suspect there must be something in the water in Washington, DC. The current flavor of the month is the negotiations over raising the national debt ceiling, which likely needs to happen by June 1 in order to avoid the first-ever default on our national debt. If this sounds vaguely familiar, that's because it's a well-worn impasse that already played out in 1954, 1957, 1979, 1985, 1996, 1997, 2011, 2013, 2015, 2017, 2019, and 2021.
No matter which side you take in this battle, there's no denying our national debt is scarily enormous. The gross national debt is $31.46 trillion dollars. That amount is equivalent to winning the largest lottery jackpot ever 15,421 times. If you had the amount in $1 bills, you could make eight stacks of cash that reach the Moon and still have $3.3 trillion left over.
The debt grows when Congress fails to balance the budget and revenue from taxes doesn't match the budgeted spending levels. This has been the case in all but seven of the past 70 years. No matter which party is in charge, our elected leaders have proven that a balanced budget is not their priority and so-called fiscal responsibility is just a political talking point. Even when Congress has tried to force itself to cut spending, it has conveniently gotten cold feet.
In the past 15 years, the federal government has earmarked dollars specifically for interoperability and health IT, but rest assured that this has been a very minor contributor to our national debt. As the table below shows, the ONC's budget hasn't even kept up with inflation, and if you assume every budgeted dollar was paid for with borrowed money, the total addition to the national debt would be less than a billion dollars.
Annual budget for the ONC1
| Fiscal Year | Budget (current dollars) | Budget (Apr 2023 dollars) |
|---|---|---|
| 2010 | $61,342,000 | $86,081,740 |
| 2011 | $61,342,000 | $85,084,400 |
| 2012 | $61,226,000 | $82,031,720 |
| 2013 | $61,226,000 | $80,295,450 |
| 2014 | $60,367,000 | $78,413,310 |
| 2015 | $60,367,000 | $77,129,610 |
| 2016 | $60,367,000 | $76,998,270 |
| 2017 | $60,367,000 | $75,758,860 |
| 2018 | $60,367,000 | $74,243,460 |
| 2019 | $60,367,000 | $72,416,770 |
| 2020 | $60,367,000 | $71,161,450 |
| 2021 | $62,367,000 | $72,660,180 |
| 2022 | $64,238,000 | $70,456,280 |
| 2023 | $66,238,000 | $65,391,440 |
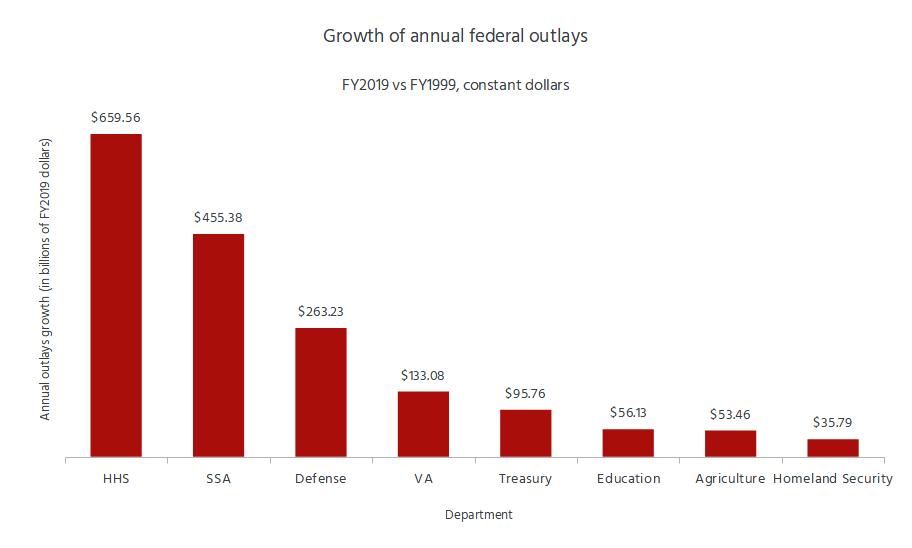
Similarly, the incentive payments CMS provided to eligible providers and hospitals for adopting EHRs totaled roughly $20 billion, and these outlays have fallen significantly over the past 5-6 years as the federal government has shifted to sticks over carrots. In contrast, outlays for several federal Cabinet-level agencies have grown significantly in the past two decades, led by HHS' almost $1 trillion increase in annual expenditures ($650 billion in constant dollars).2
This is important because any spending cuts to resolve the debt ceiling battle are likely to fall heavily on the kinds of discretionary programs and low-profile agencies that support greater interoperability in healthcare, but that will probably yield little in the way of savings. And cutting spending around interoperability would delay much needed investments, such as adopting new standards and boosting the use of EHRs in post-acute settings. As they duke it out over the debt ceiling, Democrats and Republicans should be careful not to treat interoperability initiatives as a problem, when they are in fact a much-needed solution.
---
Photo by Alice Pasqual on Unsplash
Notes and methodologies
Note 1: ONC's budget
Links to the appropriations bill for each fiscal year are in the table. In most cases, you can find the budgeted amount within the bill text by searching for "national coordinator" within the page. Fiscal years 2011 and 2013 simply maintained the budgeted levels of the prior fiscal year. Fiscal year 2012 included 0.189% across-the-board cuts in discretionary spending for HHS. The value of each amount was converted from dollars at the beginning of the fiscal year (which is October of the previous calendar year) to April 2023 dollars using BLS' CPI Inflation Calculator.
Note 2: Federal outlays
Defense spending includes military spending, civil works, and the Corps of Engineers. Social Security Administration outlays include on- and off-budget expenditures. Source: Table 4.1 - Outlays by Agency 1962-2028. Dollar amounts were converted to equivalent dollars in October 2018 using BLS' CPI Inflation Calculator.